System Misc Note - Vol4
Use journalctl to inspect daemon log
After restarting my dae service, I suddenly found that my network was corrupted. Even ping 8.8.8.8 would fail with “ping: connect: Network is unreachable”.
Test with:
1
2
$ ip -4 route get 8.8.8.8
RTNETLINK answers: Network is unreachable
Use nmcli device show to inspect current net status. It is stranged that I dont have IP4.ADDRESS here:
1
2
3
4
5
6
7
8
9
10
11
12
13
14
15
16
17
18
19
20
21
22
23
24
25
26
27
28
29
30
31
32
33
34
$ nmcli device show
GENERAL.DEVICE:                         wlp0s20f3
GENERAL.TYPE:                           wifi
GENERAL.HWADDR:                         5C:B4:7E:8D:69:FE
GENERAL.MTU:                            1500
GENERAL.STATE:                          100 (connected)
GENERAL.CONNECTION:                     Tsinghua-IPv4
GENERAL.CON-PATH:                       /org/freedesktop/NetworkManager/ActiveC>
IP4.GATEWAY:                            --
IP6.ADDRESS[1]:                         2402:f000:5:7801:49e7:7d3f:635a:a9e2/64
IP6.ADDRESS[2]:                         2402:f000:5:7801:a3ff:72f2:d328:45b2/64
IP6.ADDRESS[3]:                         fe80::8a1f:d204:3f0a:efeb/64
IP6.GATEWAY:                            fe80::9e74:6fff:fe9f:d001
IP6.ROUTE[1]:                           dst = fe80::/64, nh = ::, mt = 1024
IP6.ROUTE[2]:                           dst = 2402:f000:5:7801::/64, nh = ::, m>
IP6.ROUTE[3]:                           dst = ::/0, nh = fe80::9e74:6fff:fe9f:d>
IP6.DNS[1]:                             2402:f000:1:801::8:28
IP6.DNS[2]:                             2402:f000:1:801::8:29

GENERAL.DEVICE:                         lo
GENERAL.TYPE:                           loopback
GENERAL.HWADDR:                         00:00:00:00:00:00
GENERAL.MTU:                            65536
GENERAL.STATE:                          100 (connected (externally))
GENERAL.CONNECTION:                     lo
GENERAL.CON-PATH:                       /org/freedesktop/NetworkManager/ActiveC>
IP4.ADDRESS[1]:                         127.0.0.1/8
IP4.GATEWAY:                            --
IP6.ADDRESS[1]:                         ::1/128
IP6.GATEWAY:                            --

......

GENERAL.DEVICE:                         dae0
Well, althougn still confused, I strongly suepect it was caused by dae service. Then use journalctl -b -u dae --no-pager | less to check log:
1
2
3
4
5
6
7
...
Jul 27 00:12:04 nixos dae[2858]: level=fatal msg="duplicated outbound name: common_proxy"
Jul 27 00:12:04 nixos systemd[1]: dae.service: Main process exited, code=exited, status=1/FAILURE
Jul 27 00:12:04 nixos systemd[1]: dae.service: Failed with result 'exit-code'.
Jul 27 00:12:04 nixos systemd[1]: Failed to start dae Service.
Jul 27 00:12:04 nixos systemd[1]: dae.service: Consumed 582ms CPU time, 153.8M memory peak, 31.6M read from disk, 2.5K incoming IP traffic, 1.1K outgoing IP traffic.
...
journalctl command
-f , follow new logs live
-b , only see logs during this boot
-u <name> , view logs for specific service
–since <time> , filter by time. like:
since today,since "1 hour ago",--since "2026-06-01 00:00:00" --until "2026-06-01 12:00:00"
Ah… it is just because of wrong config file. After fixing it and rebooting, everything is back to normal.
Set ‘prefer-no-csd’ of niri
After I install Prism Launcher and started playing minecraft, it came out that there was always a disturbing bar at top, and the bottom of origin window was crowded out of screen.
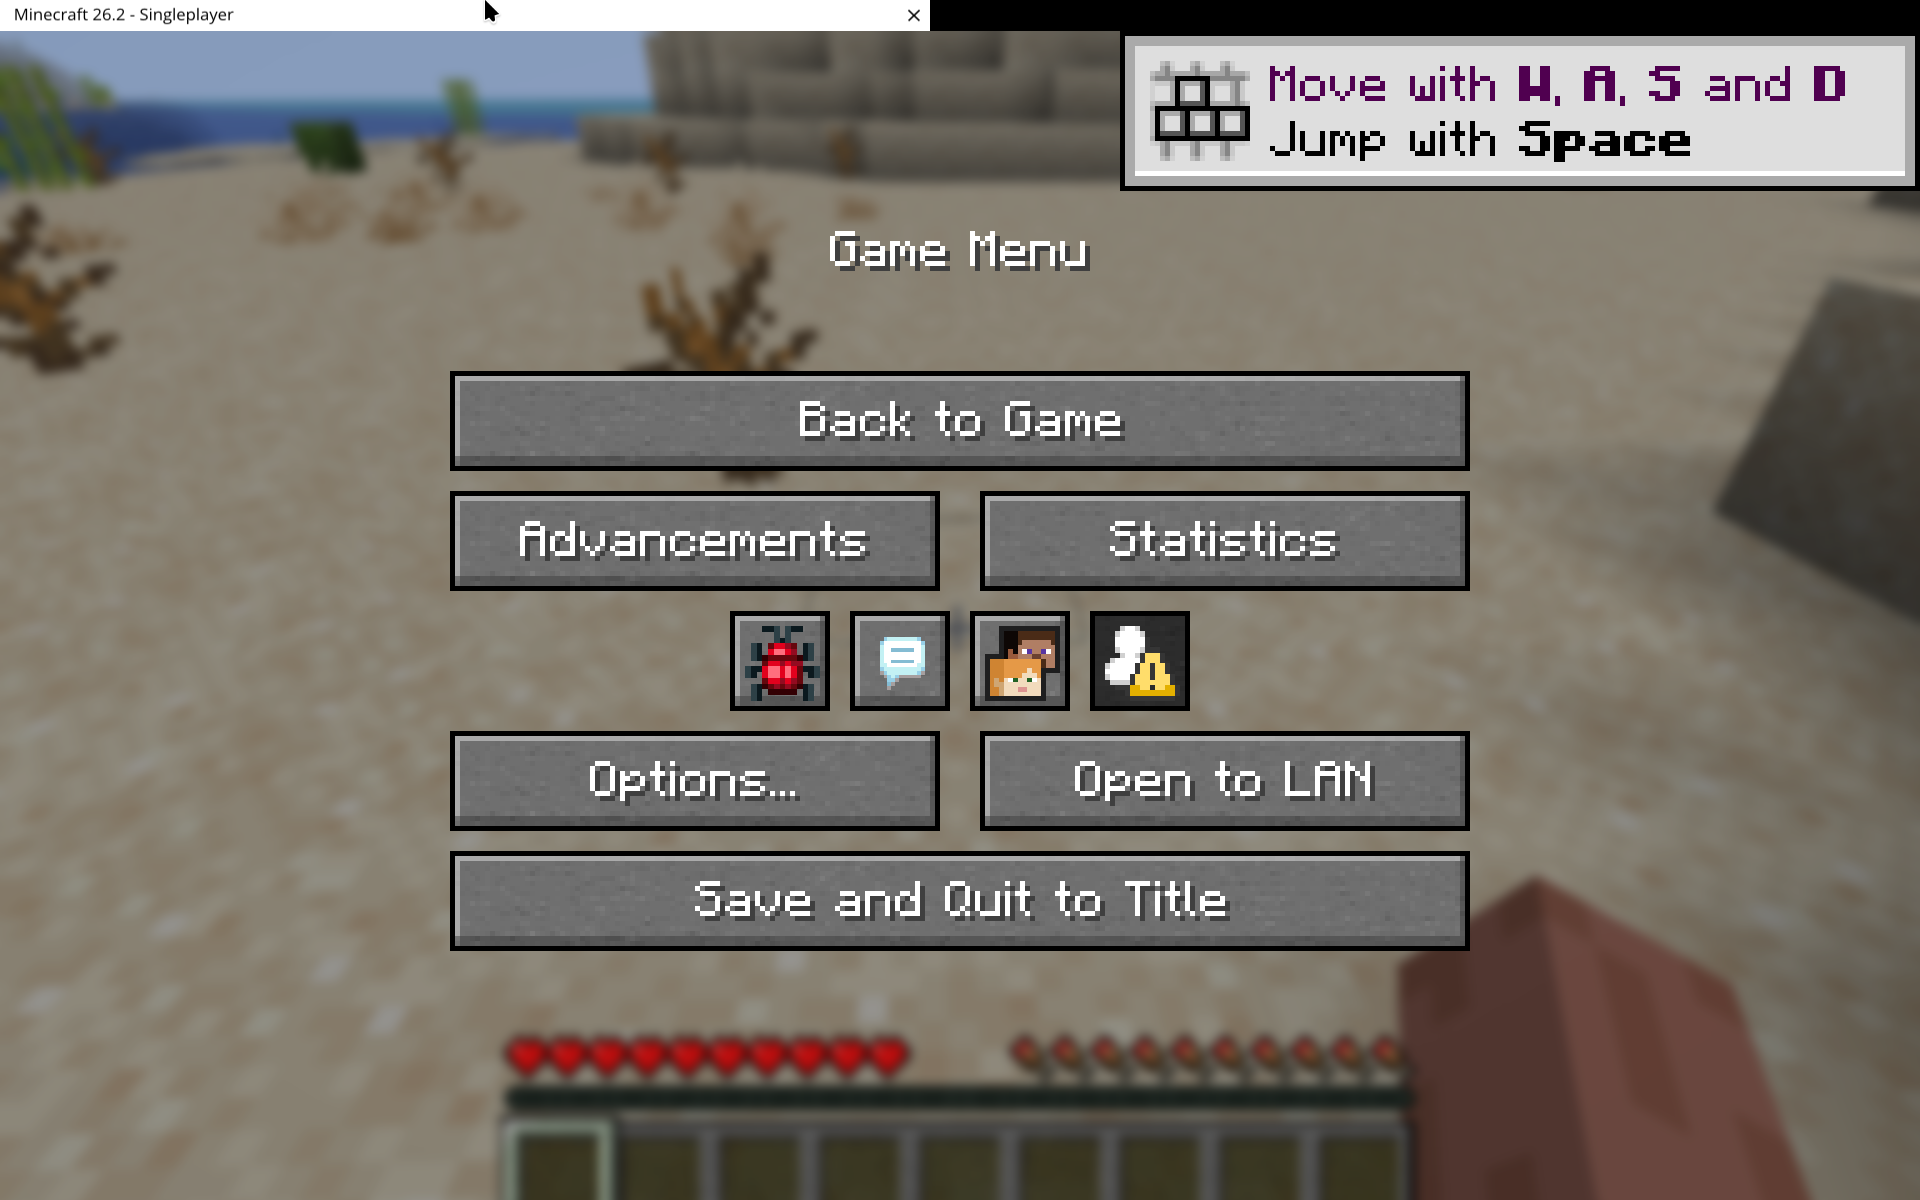
At first I use niri’s mod + shift + f to make it fullscreen. It only works temporarily, however. Once I click some button in the game, the fucking top bar appears again.
Use niri msg windows to inspect. After niri fullscreen:
1
2
3
4
5
6
7
8
9
10
11
Window ID 85:
  Title: "Minecraft 26.2 - Singleplayer"
  App ID: "Minecraft 26.2"
  Is floating: no
  PID: 1493
  Workspace ID: 1
  Layout:
    Tile size: 1536 x 960
    Scrolling position: column 5, tile 1
    Window size: 1536 x 960
    Window offset in tile: 0 x 0
After click a button in game:
1
2
3
4
5
6
7
8
9
10
11
Window ID 85:
  Title: "Minecraft 26.2 - Singleplayer"
  App ID: "Minecraft 26.2"
  Is floating: no
  PID: 1493
  Workspace ID: 1
  Layout:
    Tile size: 1536 x 984.80
    Scrolling position: column 5, tile 1
    Window size: 1536 x 985
    Window offset in tile: 0 x 0
Okay, obviously there were extra 25px after click event, which caused niri to re-calculate window size.
The solution is: turn on prefer-no-csd in niri. (In NixOS, it is programs.niri.settings.prefer-no-csd = true).
But note that the change of niri often needs logout & login again to take effect. Then the top bar is finally gone. Gooooood!
coredumpctl
When encountering program crash, we can use coredumpctl to view log.
1
coredumpctl list --since "2026-07-30 12:06:30"
Check the real log (optional: --no-page):
1
2
coredumpctl info isaac.x64
coredumpctl info <pid>